Conditional Probability
A visual guide to understanding how new information changes probability.
§1The concept
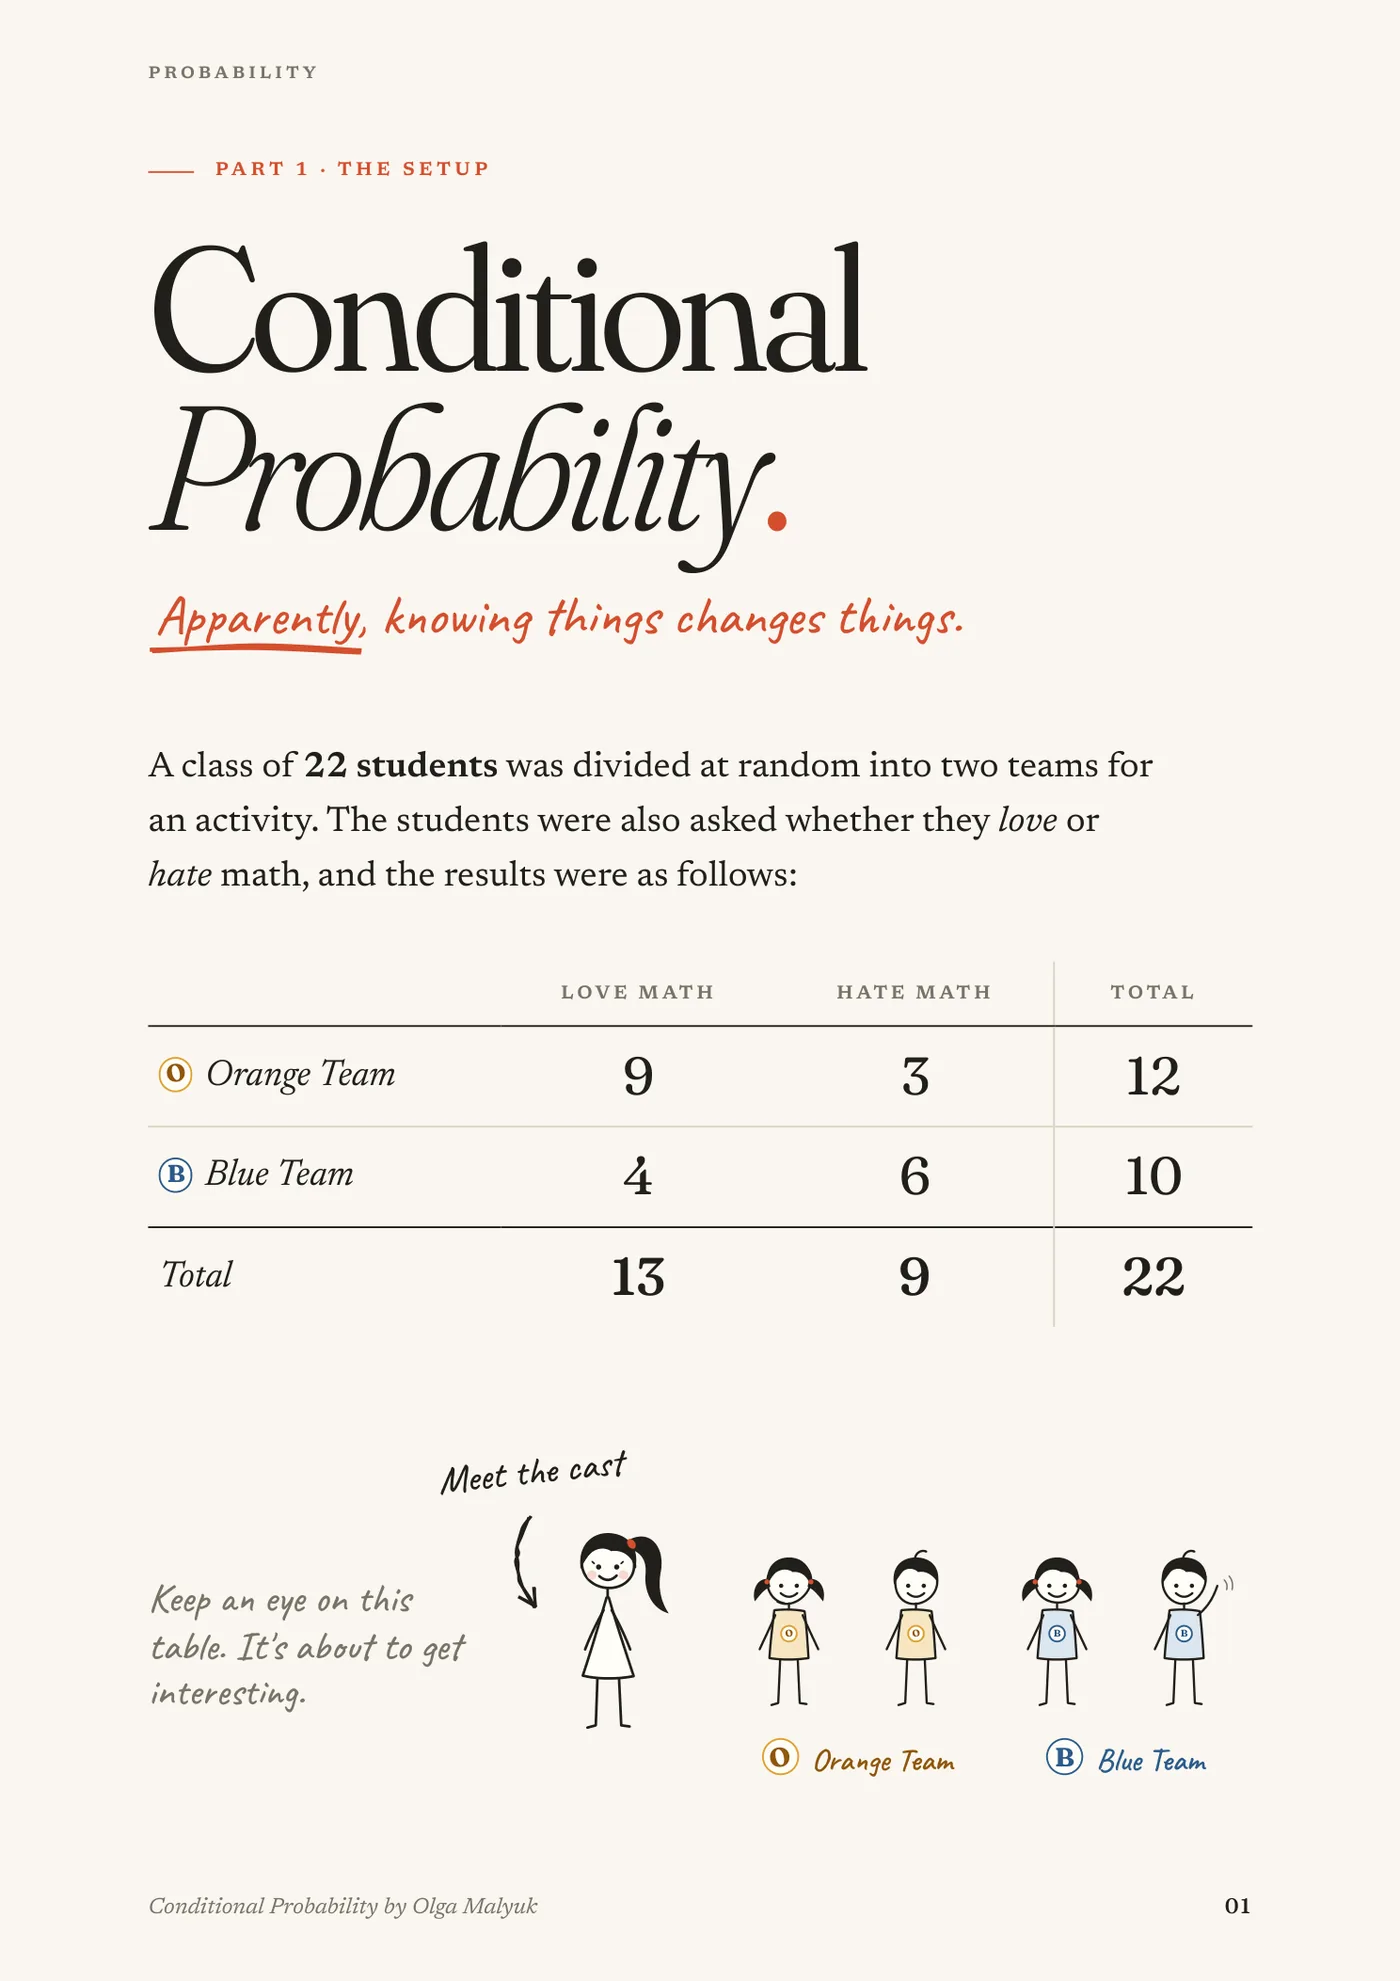
The guide builds conditional probability from one classroom story: 22 students, split at random into an Orange Team and a Blue Team, each asked whether they love or hate math.
Written as an introduction, it starts from the simplest case, where every student is equally likely to be chosen. It moves from P(B ∩ H) = 6/22 to P(H | B) = 6/10, introduces the notation, derives the general definition P(A | B) = P(A ∩ B) / P(B), and ends with six exercises and an answer key.
§2The learning problem
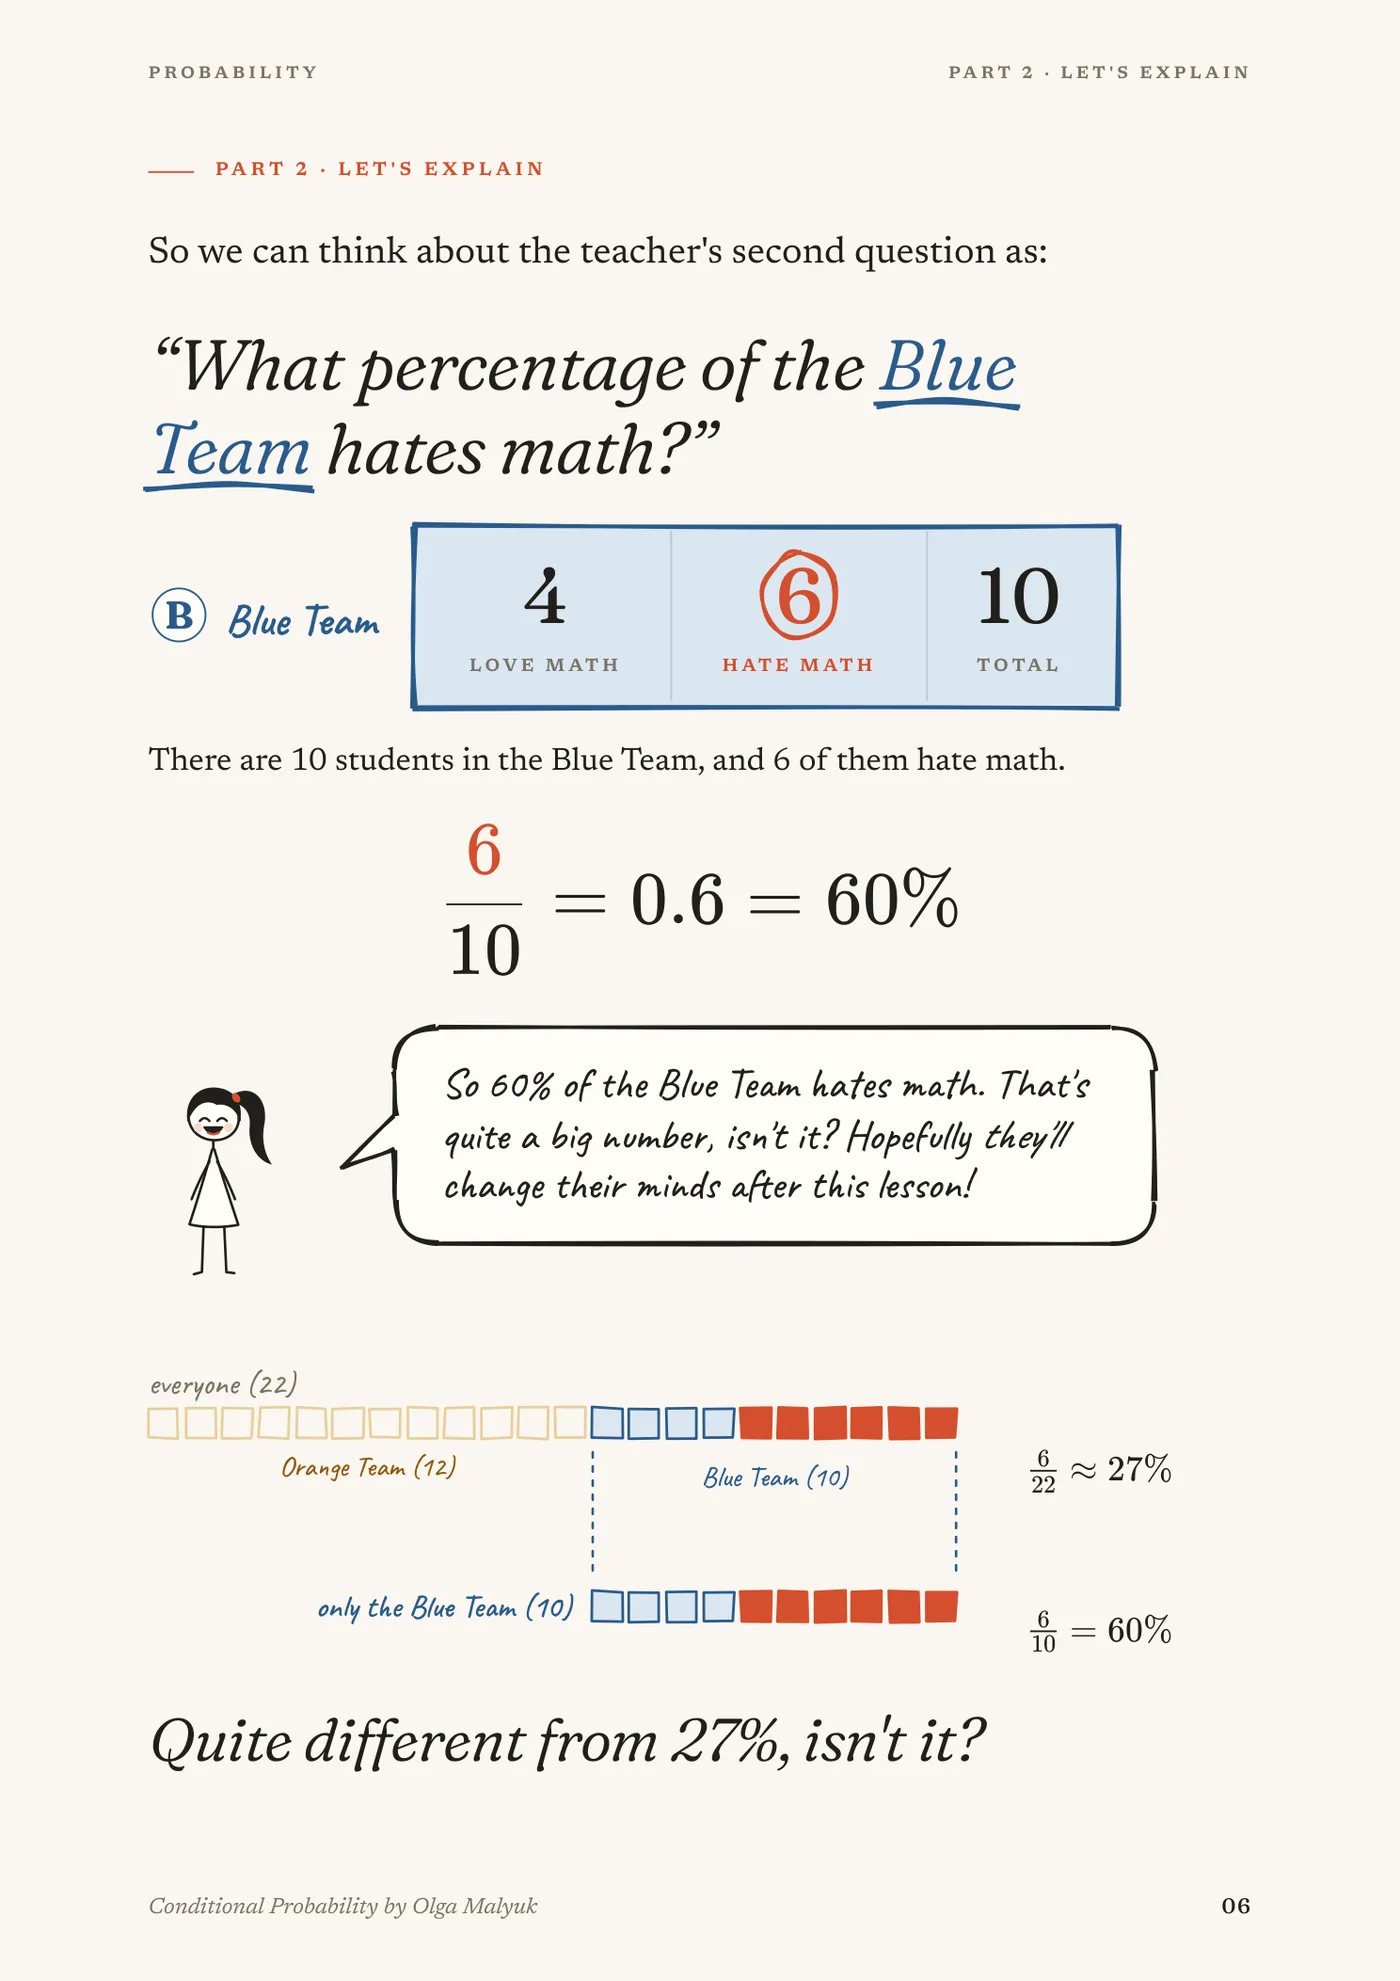
The same six students give two different answers. Picked from the whole class, a Blue Team student who hates math has probability 6/22 ≈ 27%. Picked from the Blue Team alone, the probability of hating math is 6/10 = 60%.
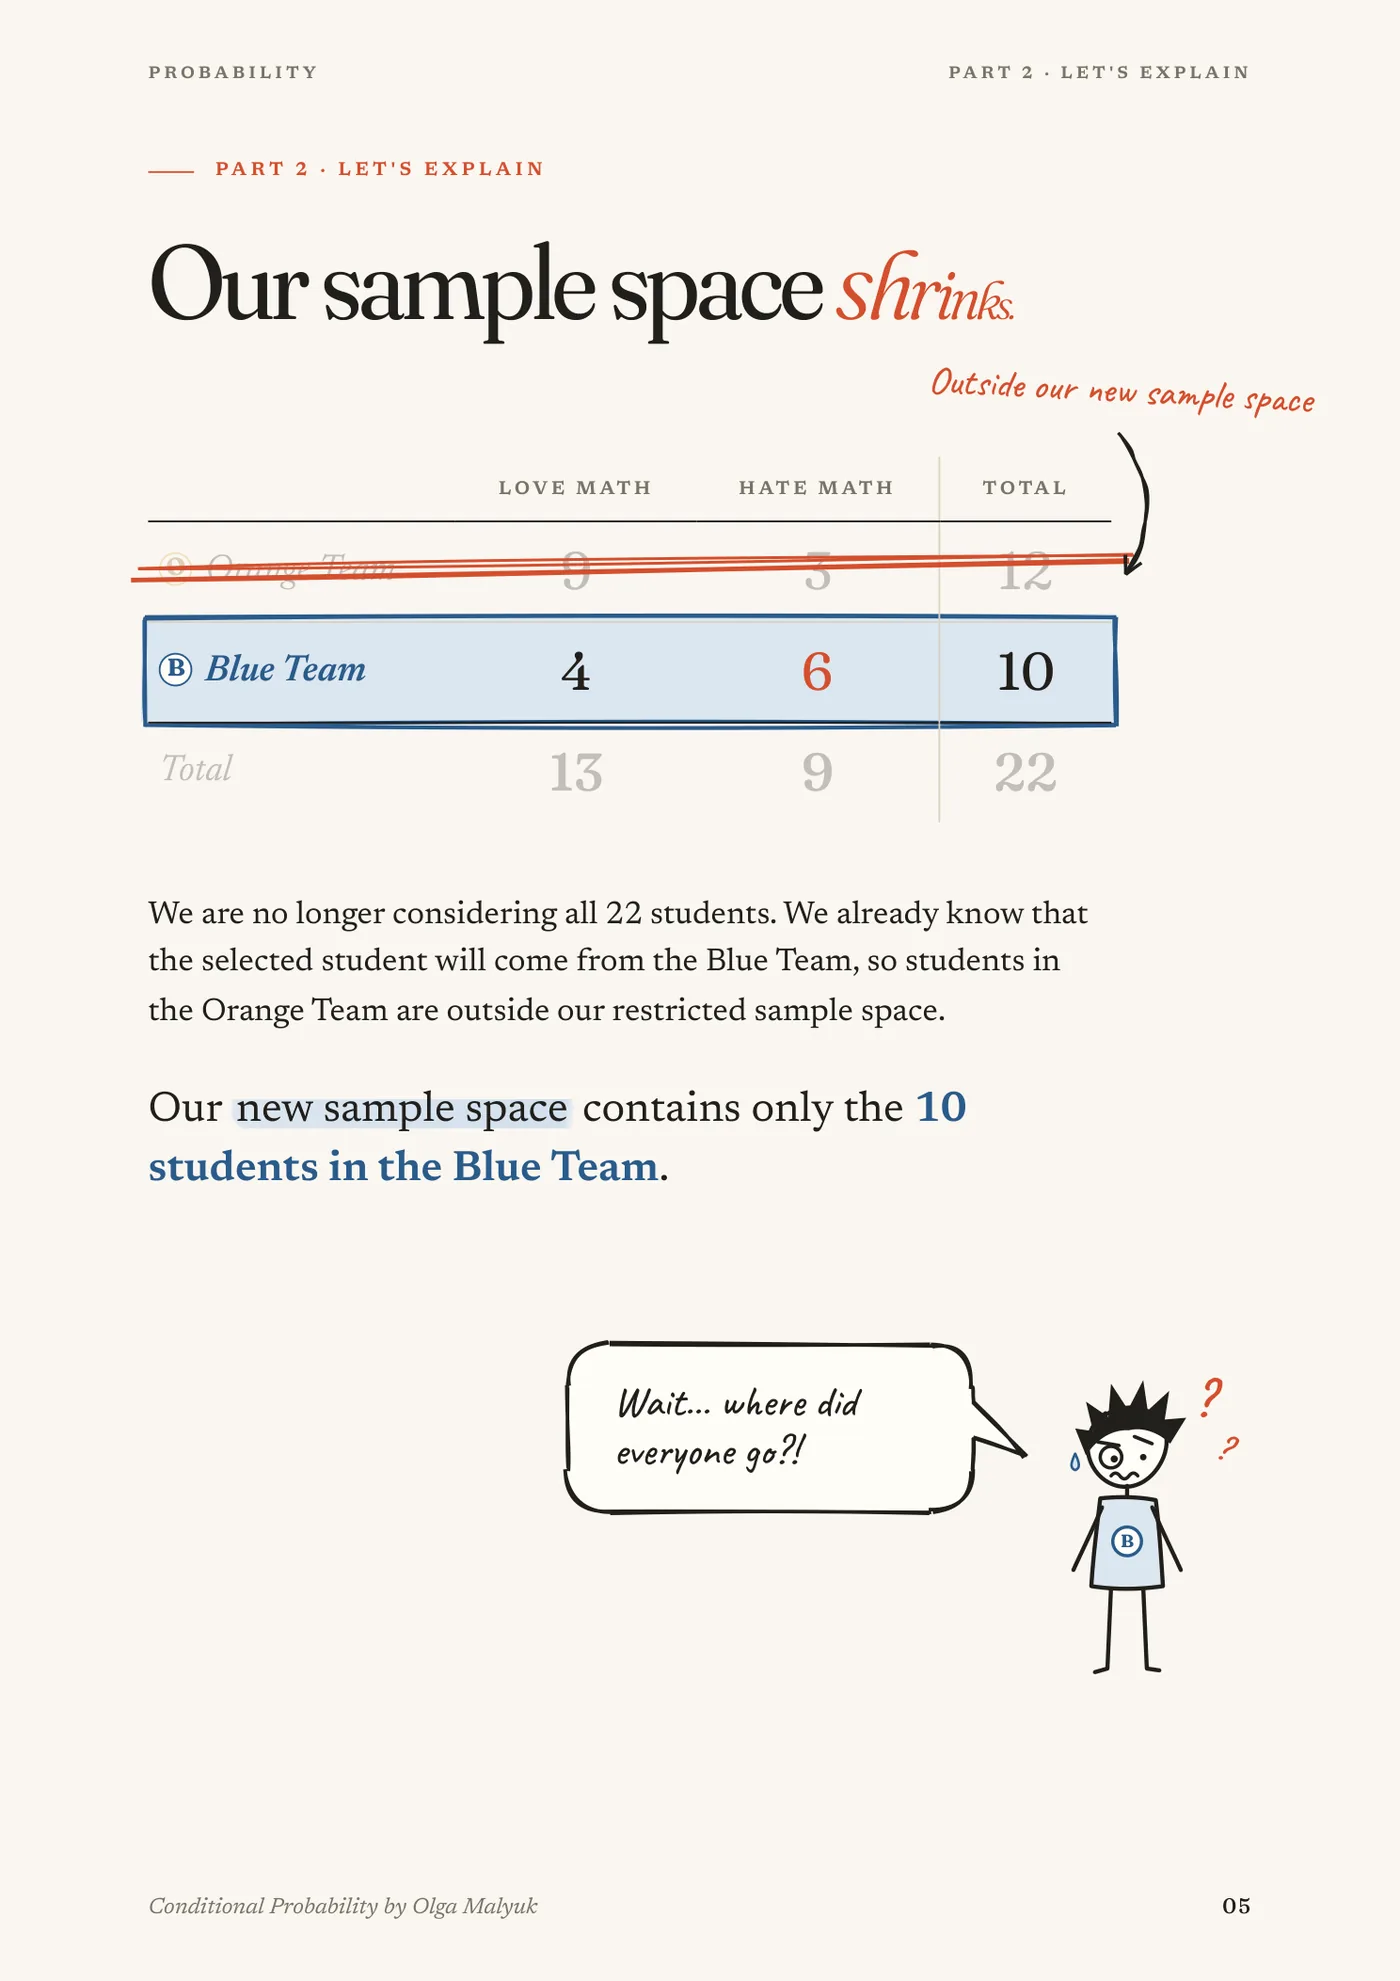
The story voices the tempting answer, “6/22…?”, then shows what actually changed: the sample space, which shrinks from 22 students to 10. The exercises return to two related traps: swapping the events, P(H | B) versus P(B | H), and assuming that new information can only make a probability smaller.
§3The visual approach
Colour tracks the events throughout: blue for the Blue Team and the condition B, red for students who hate math. Handwritten notes and speech bubbles sit beside the calculations.
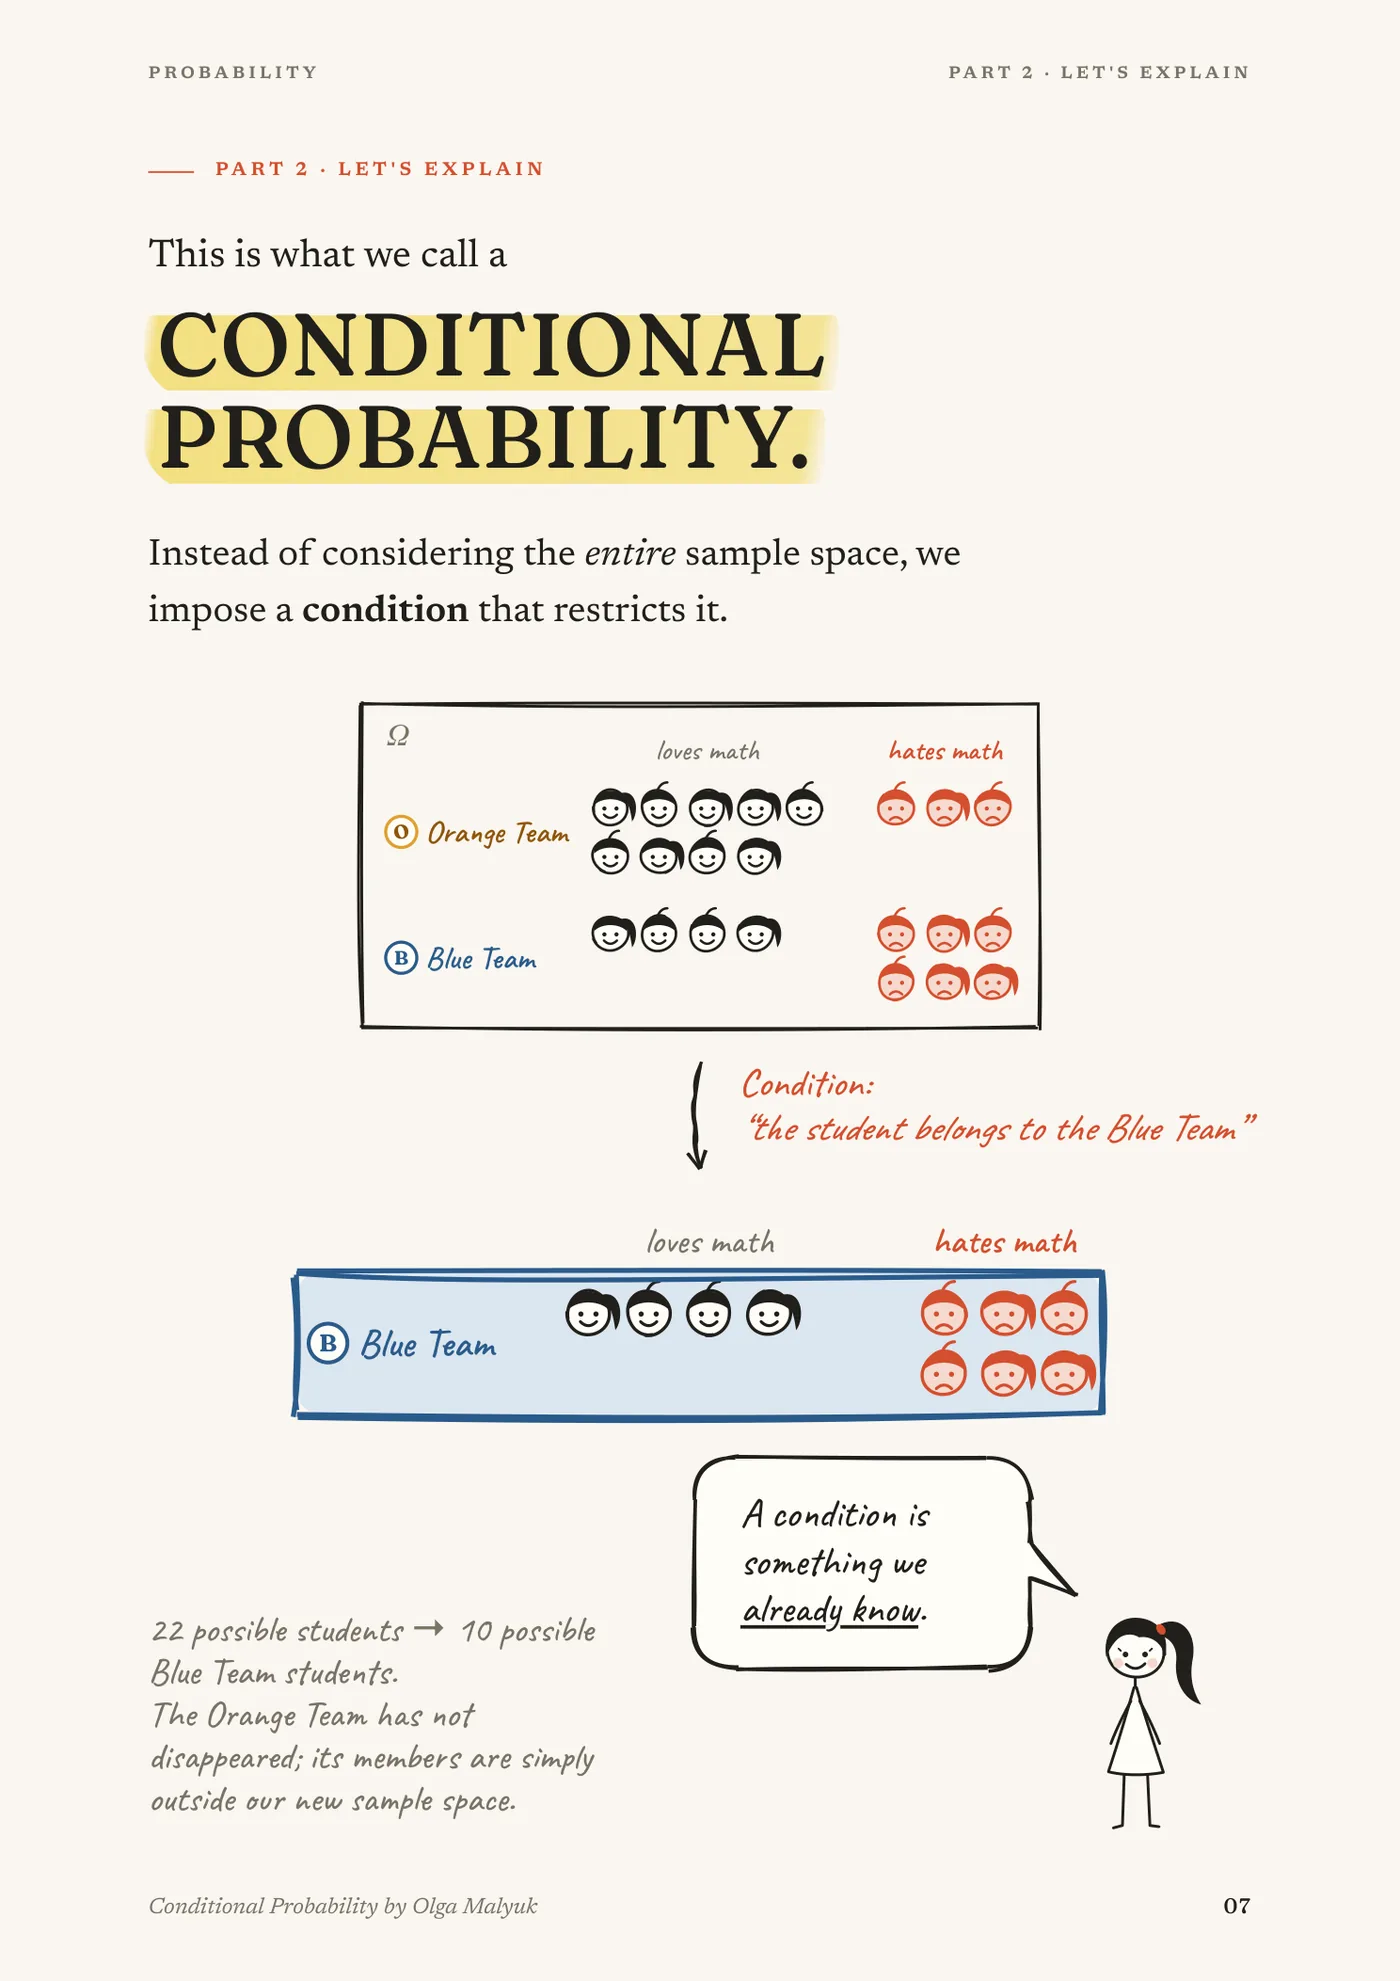
Page 7Every student is drawn as a face. Applying the condition keeps only the Blue Team row, so 22 possible students become 10, and a note explains that the Orange Team is outside the new sample space, not gone. 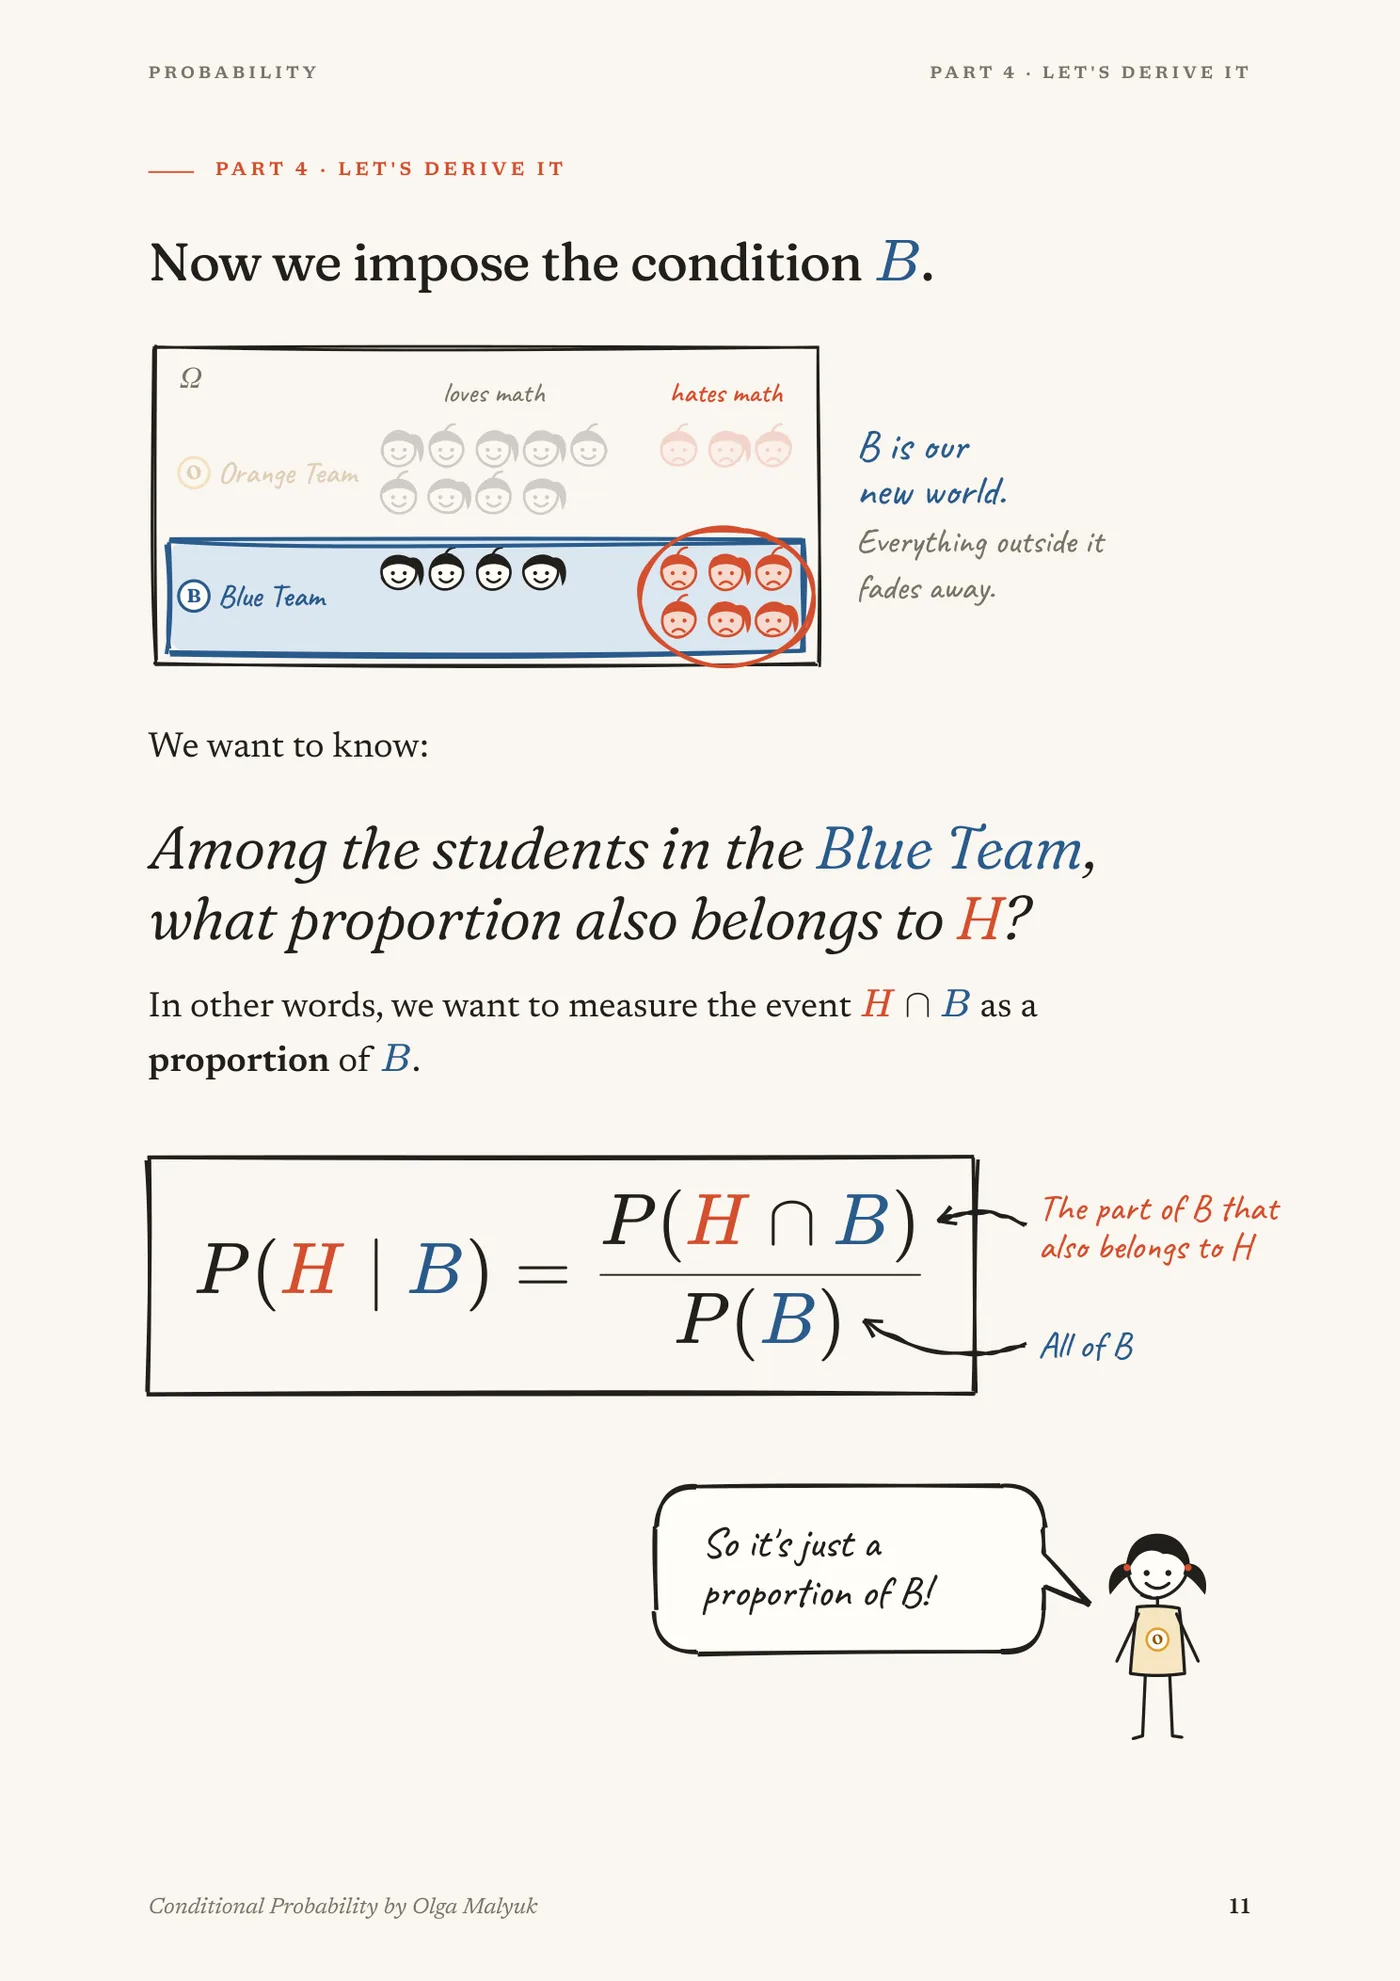
Page 11When the formula is derived, the same picture returns: everything outside B fades, and arrows tie the numerator to “the part of B that also belongs to H” and the denominator to “all of B”. 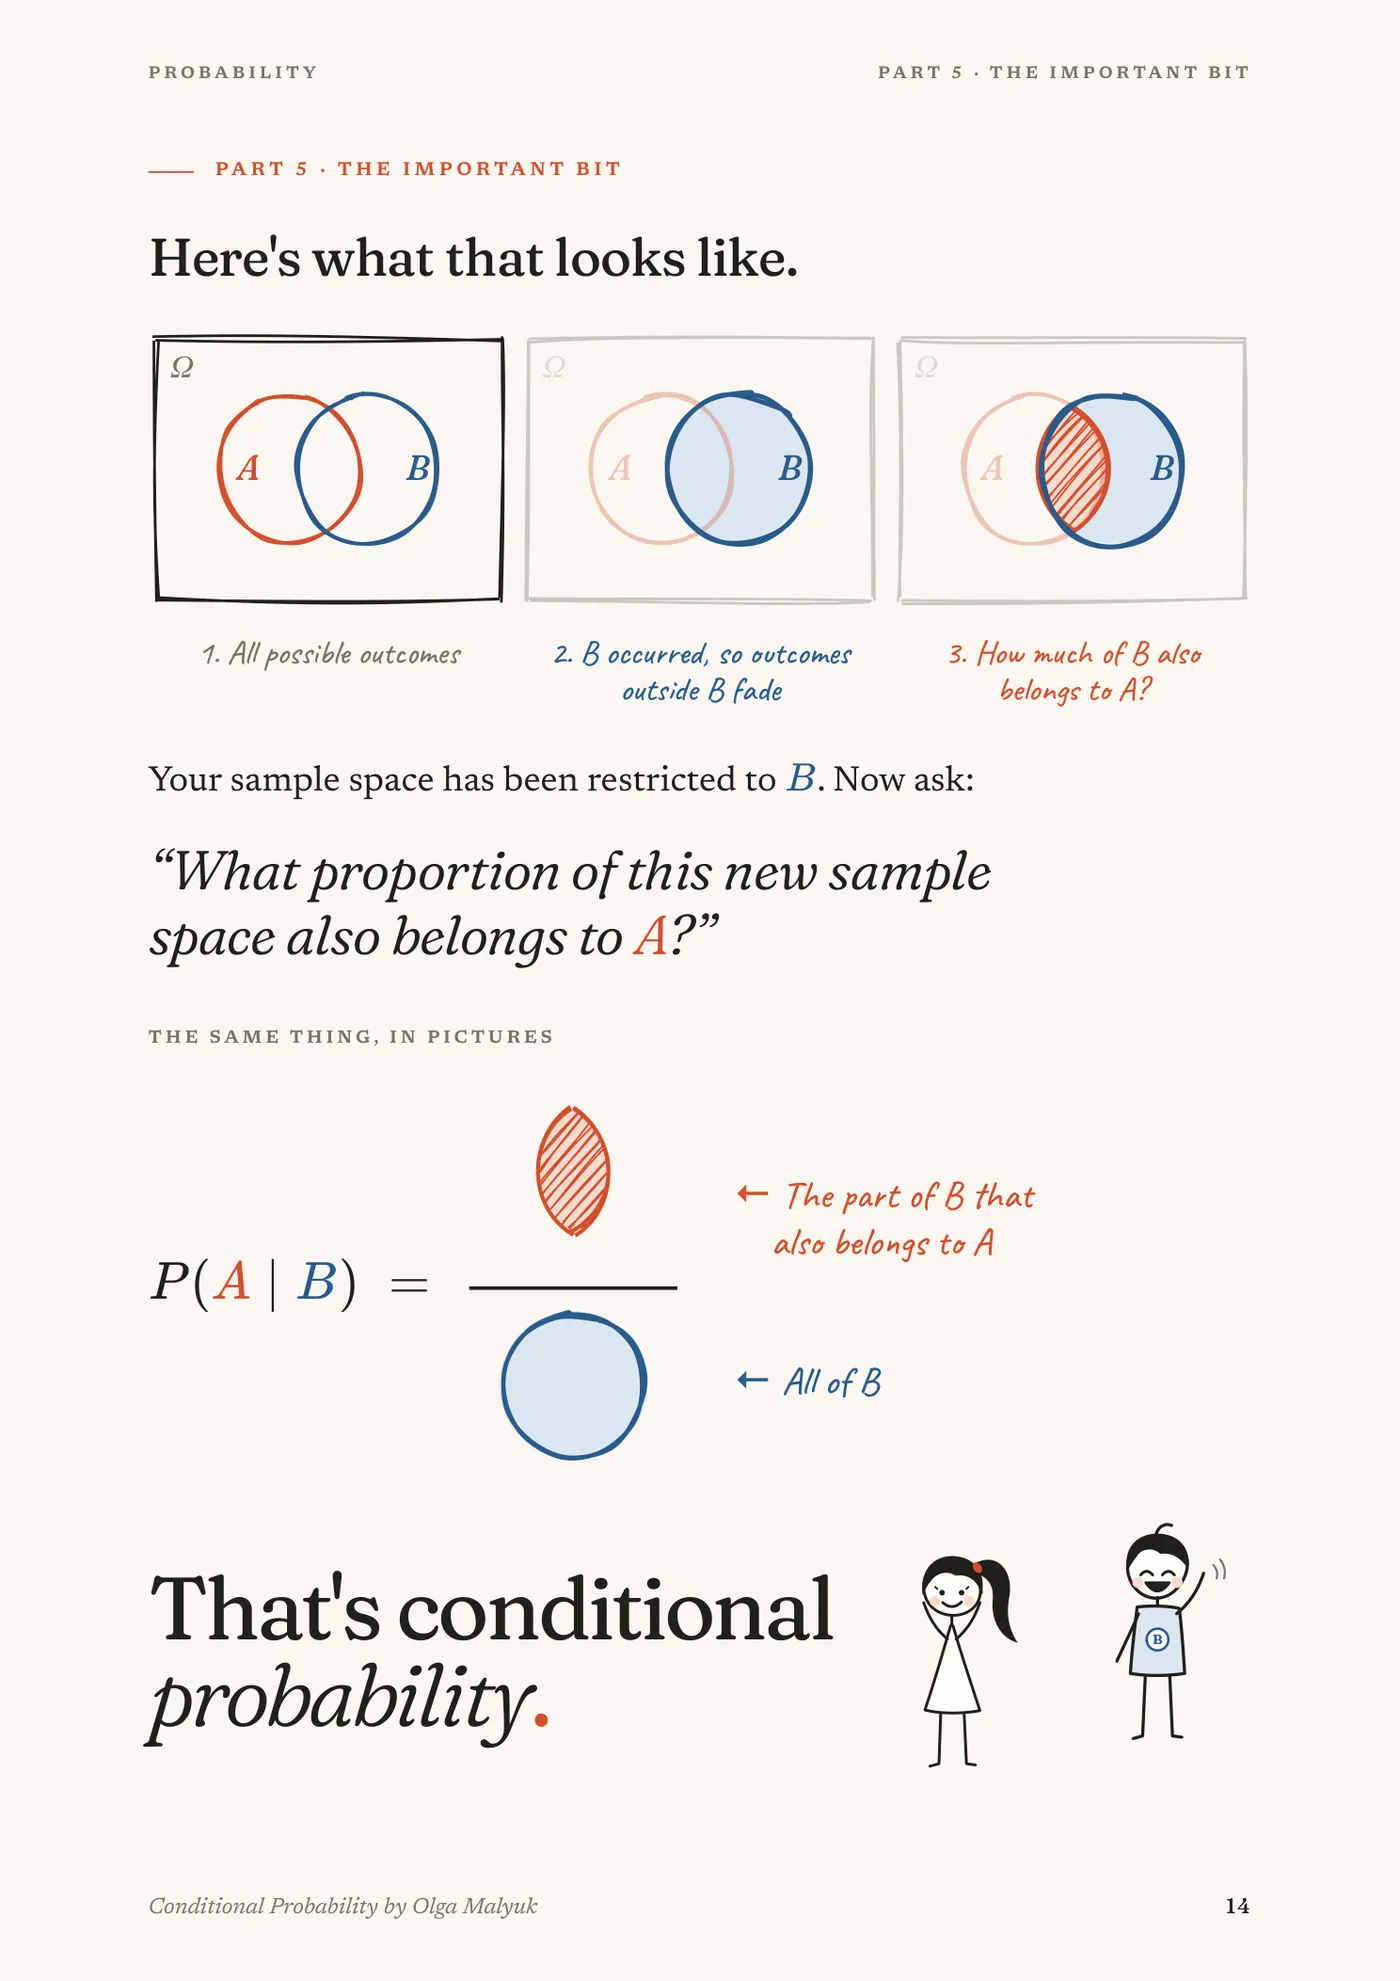
Page 14The general case in three Venn diagrams, ending with P(A | B) drawn as a fraction made of the shapes themselves.
§4The complete guide